What is Divergence in Trading
How to trade Rsi divergence and how to use it and what is rsi divergence, all these topics will discuss it here in this post, The divergence happen when the price of an asset is moving in the opposite direction of a technical indicator, such as an oscillator, or is moving contrary to other data. To detect divergence in your Trading chart, you need to know the following concepts; Higher highs – Higher lows – Lower highs – Lower lows.
Before you continue be sure to set your Metatrader chart.
Before you continue be sure to set your Metatrader chart.
1 – Higher highs
When the peaks are ascending on a chart, and uptrend can be seen happening.

2 – Higher lows
When the troughs are ascending on a chart, and uptrend can be seen happening.

3 – Lower highs
In contrast to overall increase in value that an uptrend indicates, downtrends can be seen with the descending peaks that a chart shows.
4 – Lower lows
When the troughs are descending on a chart, and downtrend can be seen happening.

Now after we identified the concepts of divergence, let’s identify the bullish divergence and bearish divergence in a trade.
Bullish divergence
Bullish divergence happens when we have a Lower low price chart and a higher low oscillator
Lets consider the RSI oscillator in our example
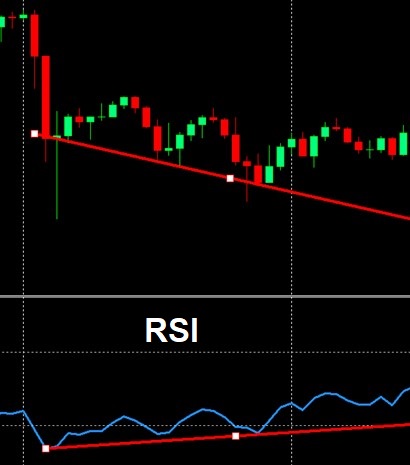
In that case we have a bullish divergence, and it is a good prediction that the price it will go up
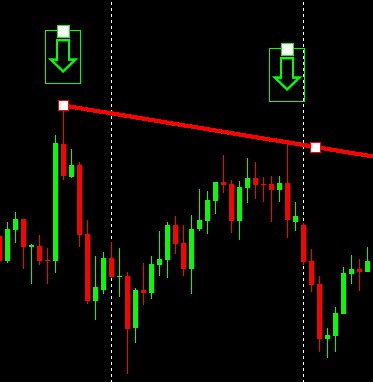
Bearish divergence
Bearish divergence happens when we have a Higher high price chart and a lower high oscillator
Let’s consider the RSI oscillator in our example
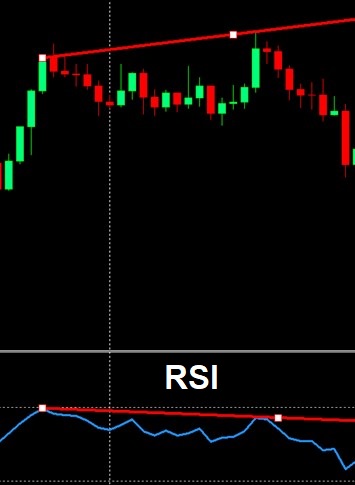
In that case we have a bearish divergence, and it is a good prediction that the price it will go down
You can apply divergence on any type of technical indicators, on CCI, MACD or any other oscillator, also you can apply it on any type of chart even it is forex, commodities, stocks, bitcoin, crypto etc ..
Check our video on YouTube showing how to trade RSI divergence